


What is Allocation and System Expansion in Life Cycle Assessment (LCA)

What is Allocation and System Expansion in Life Cycle Assessment (LCA)

Multifunctionality

Allocation and system expansion in life cycle assessment

Most real production systems make more than one thing. A refinery yields a dozen fractions from one barrel. Chlor-alkali electrolysis yields sodium hydroxide, chlorine, and hydrogen simultaneously. A dairy yields milk and, eventually, meat. Recycling turns one system’s waste into another’s input.

In each case the LCA practitioner faces the same question: the process has one set of inputs and emissions, but several useful outputs. How much of that burden belongs to each? This is the multifunctionality problem, and allocation and system expansion are the two families of answer.

It matters because the choice is not marginal. On the same inventory data, switching from mass to economic allocation can move a co-product’s carbon footprint by a factor of five or more. Two studies of the same product, both technically correct, can reach opposite conclusions purely on this decision. That is why ISO requires the choice to be justified, documented, and tested — not simply made.

ISO 14044

The allocation hierarchy is not optional

ISO 14044 clause 4.3.4.2 sets a strict order of preference. Practitioners frequently skip to step three because it is easiest; a reviewer will ask why steps one and two were not attempted.

1

Avoid allocation wherever possible

Either by subdivision — breaking the multifunctional unit process into sub-processes and collecting separate data for each — or by system expansion, extending the boundary to include the additional functions. Subdivision is preferred where the plant data supports it, because it requires no assumptions at all.

2

Allocate on an underlying physical relationship

Where allocation cannot be avoided, partition the burden according to a physical property that genuinely reflects how the outputs drive the process — mass, energy content, stoichiometry, exergy. The word that does the work here is underlying: the property must have a causal relationship to the burden, not merely be measurable.

3

Allocate on another relationship

Where no physical relationship can be established, use another relationship — in practice, almost always economic value. This is the fallback, and it must be declared as such, with the reason the physical route was rejected.

ISO 14044 also requires that the sum of allocated inputs and outputs equals the unallocated inputs and outputs of the unit process. Any allocation scheme that loses or creates mass and energy is wrong, regardless of how defensible the factor looked.

Modelling frame

Attributional or consequential — decide before you allocate

The allocation question sits downstream of a more fundamental one: what is the study for?

  • Attributional modelling asks what share of global burdens belongs to this product as the system currently operates. It partitions existing flows, which means it allocates. This is the frame for EPDs, product carbon footprints under ISO 14067, and corporate reporting.
  • Consequential modelling asks what changes if demand for this product changes. It follows marginal effects, which means it expands the system and credits avoided production. This is the frame for policy analysis and major investment decisions.

Mixing the two within one study is a common and serious error. Substitution credits inside an otherwise attributional model produce results that cannot be added to other attributional results — which defeats the purpose of a comparable declaration.

Physical allocation

Allocation by mass: the worked mechanics

Mass allocation is the most common physical route and the easiest to execute. Every input to the unit process — energy, ancillary materials, water, emissions — is partitioned across the co-products in proportion to their mass output.

Consider a unit process producing 700 kg of co-product A and 300 kg of co-product B per functional unit.
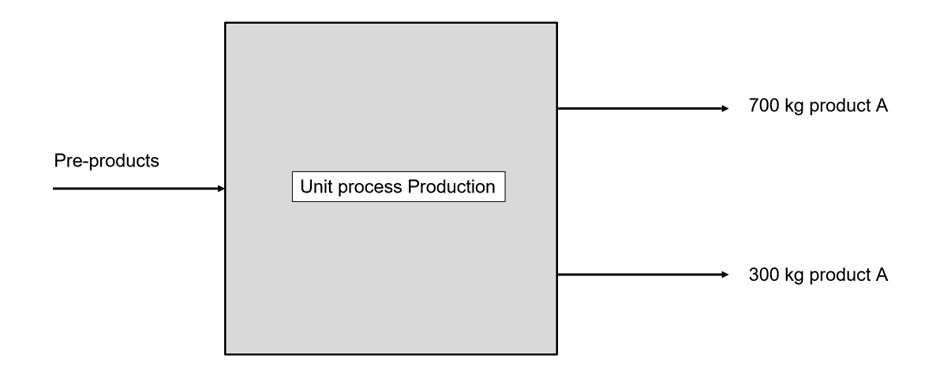
Flowchart showing inputs and co-product outputs of a unit process for mass allocation
Figure 1 — Unit process with two co-products, illustrating mass-based allocation.

Allocation factor for A = 700 ÷ (700 + 300) = 0.70

Allocation factor for B = 300 ÷ (700 + 300) = 0.30

70% of every input, emission, and waste flow is assigned to A; 30% to B. The factors sum to 1.00, satisfying the ISO 14044 mass balance requirement.

Choosing the property

When mass is the wrong physical basis

Mass is convenient, not automatically causal. ISO asks for an underlying physical relationship, which means the partitioning property should reflect why the process consumes what it consumes. Mass fails that test in several recognisable situations:

  • Energy products. Refinery streams differ enormously in energy content per kilogram. Energy-content allocation reflects the function — delivering energy — far better than mass does.
  • Very light high-value co-products. Hydrogen weighs almost nothing but carries substantial function and value. Mass allocation renders it nearly burden-free, which is not a defensible reflection of the process.
  • Chemically driven processes. Where output ratios are fixed by stoichiometry rather than by operational choice, the reaction equation, not the scale, defines the relationship.
  • Services and non-material outputs. Waste treatment, storage, and transport have no meaningful output mass to partition on.

Alternative physical bases

  • Energy content — lower or higher heating value, standard in fuel and refinery LCA
  • Exergy — captures thermodynamic quality rather than quantity; methodologically strong, rarely used because reviewers and readers find it opaque
  • Stoichiometry — where a fixed reaction determines the output ratio
  • Elemental content — carbon or nitrogen content, common in agricultural and food systems
Worked case

Chlor-alkali electrolysis: where the choice changes everything

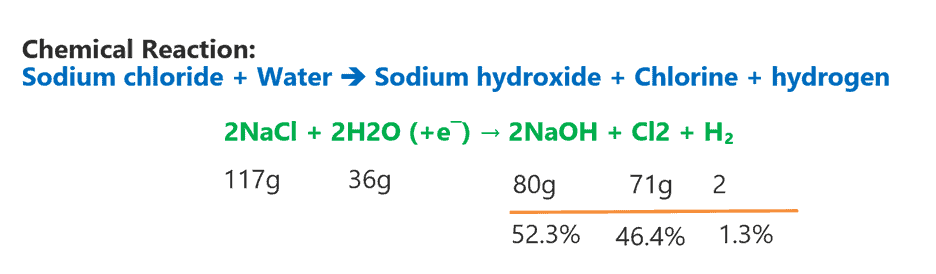
The chlor-alkali process is the standard teaching case because its output ratio is fixed by chemistry, not by operational preference. Electrolysis of sodium chloride brine yields three co-products in a stoichiometrically determined ratio. A plant cannot make more caustic soda without also making proportionally more chlorine.
Sodium chloride electrolysis producing sodium hydroxide, chlorine, and hydrogen
Figure 2 — Chlor-alkali electrolysis: sodium hydroxide, chlorine, and hydrogen as fixed-ratio co-products.

By mass, the outputs are sodium hydroxide (NaOH) at 52.3%, chlorine (Cl₂) at 46.4%, and hydrogen (H₂) at 1.3%. Sodium hydroxide is typically treated as the main product commercially, but all three have markets, so none can be dismissed as waste.

Comparison

Mass against economic allocation, on identical data

Take a basis of 1,000 kg total product output: 523 kg NaOH, 464 kg Cl₂, 13 kg H₂. Now apply illustrative market prices of USD 400/t for NaOH, USD 250/t for Cl₂, and USD 2,000/t for H₂.

Co-product Mass (kg) Mass allocation Revenue (USD) Economic allocation
Sodium hydroxide (NaOH) 523 52.3% 209.20 59.6%
Chlorine (Cl₂) 464 46.4% 116.00 33.0%
Hydrogen (H₂) 13 1.3% 26.00 7.4%
Total 1,000 100.0% 351.20 100.0%

Hydrogen’s allocated burden rises from 1.3% to 7.4% — a factor of 5.7 — purely from the choice of allocation basis. Chlorine’s falls by roughly a third. The inventory data did not change at all.

Note on the figures

The prices above are illustrative and chosen to make the mechanism visible. Real chlor-alkali economics are volatile and regionally specific; chlorine and caustic prices frequently move in opposite directions with the market cycle. Any economic allocation used in a study must draw on documented prices for the actual reference period, and that period must be stated.

Economic allocation

Using economic value defensibly

Economic allocation is the ISO fallback, and it is legitimate — but it imports market volatility into a physical result, which is why reviewers scrutinise it. Four rules make it hold up:

Use price at the point of separation, not at final sale. Value added by downstream processing belongs to that processing, not to the shared upstream burden.

Average over a defensible period. A single spot price on one date is not representative. A twelve-month average covering the inventory reference year is the usual expectation.

Document the source. Published indices, actual invoiced transactions, or plant records — and state which. Unattributed prices are a standard verification finding.

Test the result. Recalculate at the high and low of the price range across the reference period and report the effect on the conclusions.

System expansion

System expansion and substitution

System expansion sits at the top of the ISO hierarchy alongside subdivision, because it sidesteps the partitioning problem rather than solving it. Instead of splitting the burden, the boundary is widened so that the compared systems perform the same set of functions.

Two forms are worth distinguishing, and the terms are used loosely in practice:

  • True system expansion — the alternative system is expanded to include the additional function, so both systems deliver the same basket of outputs and remain directly comparable. Nothing is subtracted.
  • Substitution, or the avoided burden approach — the burden of the production that the co-product displaces elsewhere is subtracted as a credit. This is what most practitioners mean when they say system expansion.

ISO 14044 and ISO 14067 both place this ahead of allocation. In practice it carries its own difficulty: the credit depends entirely on what you assume is displaced, and by how much.

Substitution moves the uncertainty rather than removing it. The allocation factor is replaced by an assumption about the marginal displaced product — which is usually harder to defend, not easier.

The three assumptions substitution requires

  • What is displaced. Recovered hydrogen might displace steam-methane-reformed hydrogen, or grid electricity if burned for power. The two credits differ by an order of magnitude.
  • At what substitution ratio. Recycled material rarely replaces virgin material one-for-one; quality loss means a ratio below 1.0 that must be evidenced.
  • Against which marginal technology. The displaced production is the marginal supplier, not the average — and identifying the marginal supplier is a modelling exercise in itself.

Credits large enough to drive a product’s net result negative are a signal to re-examine these three assumptions before publishing.

Recycling

Allocation across recycling: the four working approaches

Recycling is the multifunctionality problem across two life cycles rather than within one process. The burden of primary production and of recovery has to be shared between the system that first used the material and the system that uses it next.

Approach How it works Where it is used
Cut-off (100:0) Each system carries its own burdens only. Recycled input enters burden-free at the point of collection; outgoing recyclate leaves with no credit. Simple, conservative, and additive across systems. Default in ecoinvent cut-off system model; widely used in attributional studies and EPDs.
Avoided burden (0:100) The first system is credited for the primary production its recyclate displaces. Rewards recyclability, but the credit rests on displacement assumptions and results are not additive. Consequential studies; end-of-life recycling arguments.
50:50 split Burdens and credits are shared equally between the supplying and receiving system. A pragmatic compromise with no strong theoretical basis, but it avoids the extremes of the two above. Some sector PCRs and national guidance documents.
Circular Footprint Formula A parameterised formula combining recycled content and end-of-life recycling through an allocation factor A, with explicit quality ratios and a market-supply parameter. Transparent about its assumptions, and demanding in the data it requires. Mandatory in the EU Product Environmental Footprint method; referenced in EN 15804+A2 module D discussions.

Under EN 15804+A2, benefits and loads beyond the system boundary are reported in module D, separately from the cradle-to-grave total, and are never added into it. That separation is the standard’s way of keeping substitution credits visible rather than buried inside a headline figure.

Sensitivity

Testing the choice is a requirement, not good practice

ISO 14044 requires a sensitivity analysis on allocation procedures. Because the choice can move results by multiples, a study that reports one allocation basis without showing what the alternatives do has not demonstrated that its conclusions are stable.

1

Recalculate under each plausible basis

Run the full impact assessment on mass, energy, and economic allocation, and on substitution where it applies. Present the range, not just the chosen figure.

2

State whether the conclusion survives

The question a decision-maker needs answered is whether the ranking changes, not whether the number changes. If product A beats product B under every basis, the conclusion is robust to the allocation choice and can be stated as such. If the ranking flips, that must be reported plainly.

3

Document the justification, not just the method

Record why the chosen basis was selected, why the higher tiers of the ISO hierarchy were not used, what data supported the factors, and what reference period applies. This is what a critical reviewer under ISO 14071 will look for first.

Common findings

Where allocation goes wrong in practice

  • Jumping straight to economic allocation without documenting why subdivision and physical relationships were rejected. The most frequent review finding on multifunctional systems.
  • Allocation factors that do not sum to unity, usually after a co-product is added or dropped mid-study without recalculating.
  • Silent inheritance from the background database. Background datasets carry their own allocation assumptions. Using a cut-off database while applying substitution in the foreground produces an internally inconsistent model.
  • Treating a co-product as waste to avoid allocating to it. If it has a market and a positive price, it is a co-product, whatever the plant calls it.
  • Substitution credits with no stated displaced product, no substitution ratio, and no marginal technology — a credit that cannot be checked.
  • Prices taken at final sale rather than at the point of separation, inflating the share carried by the most processed co-product.
Summary

What to take away

Allocation partitions the burden of a shared process among its outputs. System expansion avoids partitioning by widening the boundary, usually by crediting displaced production. ISO 14044 prefers avoidance, then physical relationships, then economic value — in that order, with the reasoning recorded at each step.

Neither approach has an optimal solution, which is precisely why the standards leave room. The flexibility is not licence: it is a requirement to choose deliberately, document the choice, test it, and report the range.

The allocation decision is where two technically correct studies most often diverge. Treat it as a decision requiring justification, not a setting in the software.

LCA ecosystem

Explore the DEISO life cycle assessment (LCA) ecosystem

DEISO’s integrated LCA ecosystem covers project execution, independent review, advisory, professional training, and technical systems built to support high-quality, ISO-aligned sustainability work.

LCA project execution

End-to-end Life Cycle Assessment execution for products, systems, and value chains with structured workflows and high technical quality.

Explore service →

LCA critical review (ISO 14040/44)

Independent technical review confirming methodological consistency, transparency, and ISO alignment.

Explore service →

Senior LCA strategic advisory

Expert-level advisory for study design, methodology, and decision-making in LCA and EPD projects.

Explore advisory →

LCA professional training

Structured professional training that lets teams build strong LCA capability aligned with ISO standards.

Explore training →

LCA software training (openLCA, GaBi, SimaPro)

Hands-on, software-focused training programs built for professionals working in openLCA, GaBi, and SimaPro environments.

Explore programs →

LCA data collection system

Structured data framework to improve consistency, reduce errors, and speed up LCA project execution.

Download system →

Request a quotation

Request a tailored quotation aligned with your LCA, review, or training needs.

Request a quotation →
1448 1024 DEISO

Contact Info.

English Address:
Level 21 Shiodome Shibarikyu Building
1-2-3 Kaigan, Minato-ku
105-0022 Tokyo, Japan.

Japanese Address:
〒105-0022 東京都港区海岸1-2-3
汐留芝離宮ビルディング21階, 合同会社DEISO.

Phone (JP): /
Phone (EN):
Fax: /
Email:

Latest News