Life cycle assessment of sodium hydroxide production at plant, 1 kg
Where the energy and raw materials for 1 kg of sodium hydroxide come from: salt, coal, natural gas and fuel oil, each with its own transport and fuel inputs.
Functional unit1 kg sodium hydroxide, production mix, at plant
Two chemicals can do the same job and still leave very different footprints. The difference comes from how each one is made: which raw materials go in, how much energy the process draws, and what ends up in the air, water and soil along the way.
Life cycle assessment (LCA) puts numbers on that. Under ISO 14040 and 14044, it follows a product from raw material extraction through production, use and disposal, and adds up the energy used, the emissions released and the impacts they cause.
What an LCA lets a chemical producer do
Compare routes — see which synthesis route, supplier or site carries the lower footprint for the same product.
Find hotspots — pin down the fuels, inputs and process steps that drive most of the impact.
Test a change on paper first — model a switch in energy source or raw material before spending money on it.
Answer customers — give buyers who ask for a product carbon footprint figures they can trace back to data.
LCA results take some effort to read, but they are what decisions on chemical production should rest on. A worked example is the quickest way to see how the pieces fit, which is what this case study is for.
The product
Sodium hydroxide at a glance
FormulaNaOHA strong base and alkali
Also calledCaustic soda, lyeSame substance, different trade names
World output, 2024About 75–83 million tonnesEstimates differ by source
Largest producerChina, about 28–31%Followed by the United States and India
How it is tradedMostly as a water solutionOver 90% of global trade is soda lye
Made alongsideChlorine and hydrogenAll three come out of the same cell
Pure sodium hydroxide is a white solid. It dissolves readily in water, splitting into sodium ions (Na⁺) and hydroxide ions (OH⁻), and it pulls moisture and carbon dioxide out of the air if left open. Between 12.3 and 61.8 °C, water solutions crystallise as the monohydrate, NaOH·H₂O, and much of the “sodium hydroxide” sold commercially is in fact this monohydrate.
In practice, most users buy it as a solution rather than a solid. It is cheaper to ship and far easier to pump, dose and mix.
Handling
Sodium hydroxide breaks down proteins at room temperature. It causes severe chemical burns on skin, can permanently damage eyes, and is dangerous if swallowed.
Production
How sodium hydroxide is made
Almost all of it comes from the chlor-alkali process. An electric current is passed through salt brine, and the brine splits into three products at once.
2 NaCl + 2 H₂O →Cl₂ + H₂ + 2 NaOHSalt and water in; chlorine, hydrogen and sodium hydroxide out
The ratio never changes. For every tonne of chlorine, a plant makes about 1.1 tonnes of caustic soda and 0.03 tonnes of hydrogen. The industry calls this bundle an electrochemical unit, or ECU.
Electricity — a membrane plant uses about 2.8 MWh per ECU, most of it in the cells themselves. Older mercury cells need about 3.6 MWh.
Steam — membrane cells save power but need extra steam to concentrate the caustic to the standard 50% commercial grade.
Technology — membrane cells made up 83.9% of installed EU capacity in 2024, with diaphragm cells at 9.7%.
Because chlorine, hydrogen and caustic soda share one cell, an LCA has to decide how to split the burden between them. That choice, called allocation, can shift the result for 1 kg of sodium hydroxide considerably.
Uses
Where sodium hydroxide ends up
Few people handle caustic soda directly, but most use products that needed it somewhere in their supply chain. The shares below are approximate global figures; sources and regions differ.
About 20% of global use
Alumina refining
The Bayer process uses it to dissolve alumina out of bauxite ore, the first step toward aluminium metal.
About 15% of global use
Pulp and paper
Kraft pulping uses it to break down wood chips and free the fibres. Bleaching and effluent treatment use more.
30–40% combined
Organic and inorganic chemicals
Neutralising acids, adjusting pH, and making intermediates such as propylene oxide, polycarbonates and a long list of sodium salts.
Soaps and detergents
Hard bar soap is made with sodium hydroxide. Liquid soap uses potassium hydroxide instead.
Textiles
Viscose rayon production, and mercerising cotton, which strengthens the fibre and helps it take dye.
Oil and gas
Added to drilling mud to raise alkalinity and neutralise acid gases such as hydrogen sulfide and carbon dioxide. Refiners also use caustic washing to strip hydrogen sulfide and mercaptans from crude; the spent caustic is hazardous waste.
Metals and testing
Degreasing metal parts, and adjusting pH, together with hydrochloric acid, in neutral salt spray corrosion tests.
Food and household
Peeling fruit and vegetables, curing olives and giving pretzels their dark crust; it is food additive E524. At home, it is the active ingredient in many drain and oven cleaners.
This case study
What this case study covers
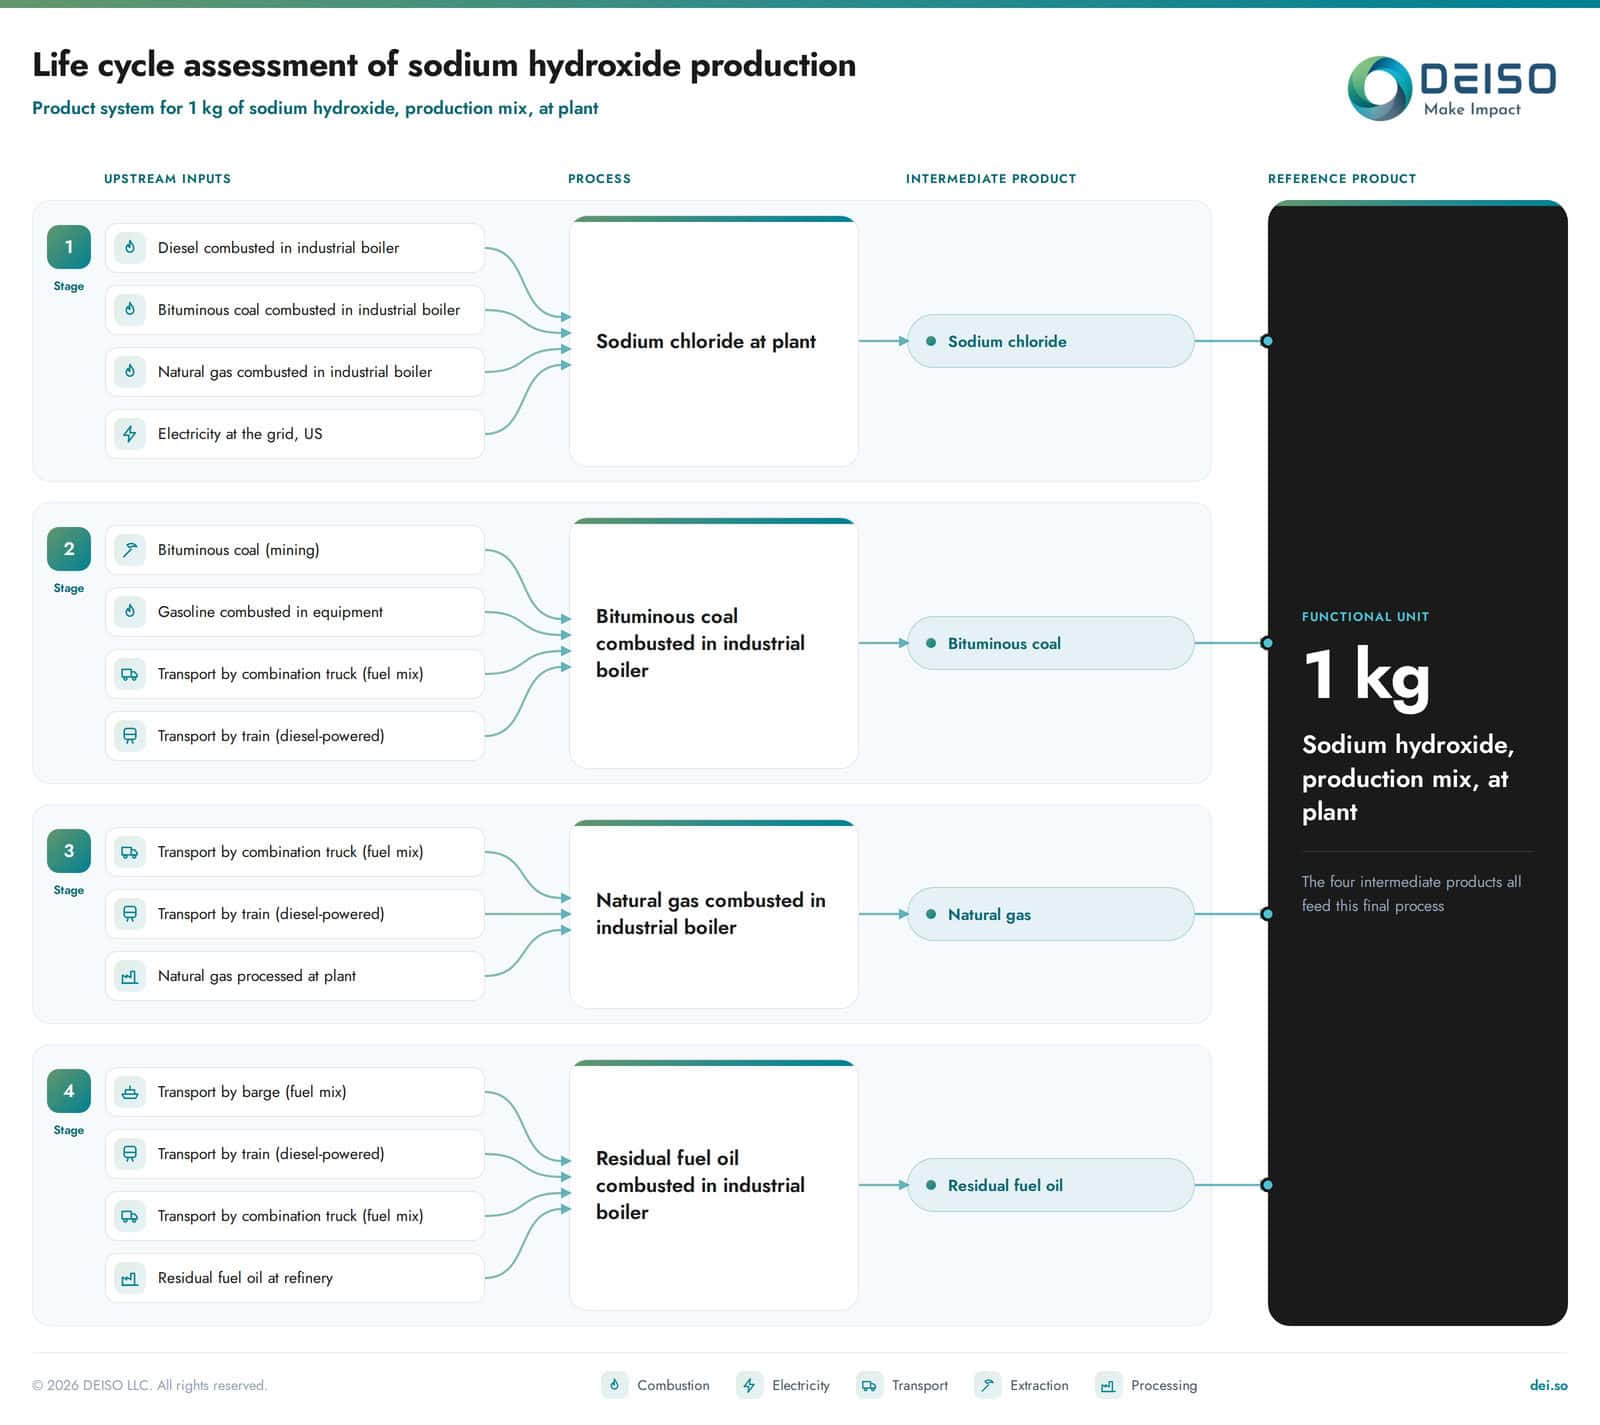
The assessment models sodium hydroxide, production mix, at plant, with 1 kg of product as the functional unit. Four supply chains feed it, each shown as a stage in the product system diagram at the top of this page.
Sodium chlorideThe salt feedstock. Its production draws on diesel, bituminous coal and natural gas burned in industrial boilers, plus grid electricity (US).
Bituminous coal, combusted in industrial boilerCoal mining, gasoline used in equipment, and transport by combination truck and diesel train.
Natural gas, combusted in industrial boilerGas processed at plant, then moved by combination truck and diesel train.
Residual fuel oil, combusted in industrial boilerFuel oil from the refinery, moved by barge, diesel train and combination truck.
Before any number is calculated, an LCA has to answer three questions: what exactly is being measured, where the study stops, and how the load is shared when one process makes more than one product. This section answers all three for sodium hydroxide.
Functional unit1 kg of sodium hydroxideEvery result is expressed per kilogram
Reference productSodium hydroxide, production mix, at plantAs it leaves the production site
Boundary typeCradle to gateFrom resource extraction to the plant gate
ElectricityUS grid mixUsed in the sodium chloride stage
The study follows the four phases set out in ISO 14040 and 14044: goal and scope, inventory analysis, impact assessment and interpretation. The sections below cover the scope. Results follow later in the case study.
Calculation
All calculations in this case study were carried out in Microsoft Excel, working stage by stage through the product system shown in the diagram at the top of this page.
System boundary
Where the system boundary sits
The boundary is drawn around everything needed to get 1 kg of sodium hydroxide to the plant gate. What happens to the product after it leaves the plant is outside the scope.
Inside the boundary
1. Sodium chlorideSalt feedstock, boiler fuels and grid electricity
2. Bituminous coalMining, equipment fuel and freight to the boiler
3. Natural gasGas processing and freight to the boiler
4. Residual fuel oilRefinery output and freight to the boiler
Plant gate1 kg sodium hydroxide leaves here
Outside
DistributionShipping to customers
UseProcessing in customer plants
End of lifeNeutralisation, discharge, waste
What each stage brings into the system
Stage
Energy and fuels
Extraction and processing
Transport
1. Sodium chloride at plant
Diesel, bituminous coal and natural gas burned in industrial boilers; grid electricity (US)
–
–
2. Bituminous coal, combusted in industrial boiler
Gasoline burned in equipment
Coal mining
Combination truck, diesel train
3. Natural gas, combusted in industrial boiler
–
Natural gas processed at plant
Combination truck, diesel train
4. Residual fuel oil, combusted in industrial boiler
–
Residual fuel oil at refinery
Barge, diesel train, combination truck
Left out of the boundary
Distribution — moving the finished product from the plant to its buyers.
Use — whatever the customer does with it, from pulping wood to making soap.
End of life — neutralisation and disposal once the sodium hydroxide has done its job.
Allocation
How shared burdens are split
Allocation is the rule for dividing emissions and energy between products that come out of the same process. Inside the four supply chains, it is not needed: each process hands a single product to the next step, so its full burden travels with that product.
The last step is different. The electrolysis cell never makes caustic soda on its own; chlorine and hydrogen come out with it, always in the same ratio. The burden of that step is therefore split between the three products by mass.
What a mass split looks like for one electrochemical unit
51.6%Sodium hydroxide, 1.1 t
46.9%Chlorine, 1.0 t
1.4%Hydrogen, 0.03 t
Shares of 2.13 t of total output per tonne of chlorine.
In plain terms: sodium hydroxide carries a little over half of what the cell room emits. Switch to a split by economic value and that share moves with market prices for chlorine and caustic soda, which is why the rule has to be stated up front.
Key findings
Six numbers worth remembering
1.05 kg CO₂ eqCarbon footprint of 1 kg of sodium hydroxide at the plant gate, calculated with CML over 100 years.
55%Share of that footprint, 0.57 kg, that arises at the sodium hydroxide plant itself. The four supply chains add the other 45%.
25%Share contributed by the natural gas chain, 0.26 kg CO₂ eq. It is the largest of the four supply chains.
15 MJFossil energy drawn from the ground for every kilogram produced.
92.9%Share of the weighted score taken by marine aquatic ecotoxicity. Every other category is 3% or less.
Under 1%Share of both the carbon footprint and the weighted score that comes from the residual fuel oil chain, the smallest of the four.
Citing this case study
How to cite these results
Use of these results
This case study is published for demonstration and learning. The results are not intended for commercial use, such as product claims or procurement decisions. They may be cited in academic reports and papers.
Suggested citationDEISO LLC (2026). Life cycle assessment of sodium hydroxide production at plant, 1 kg: a case study using the CML impact assessment method. Tokyo: DEISO LLC.
Need a footprint for your own product?
DEISO runs cradle-to-gate and cradle-to-grave LCAs and product carbon footprints for chemical producers. Tell us the product, the site and what you need the result for.
Just over half of the 1.05 kg CO₂ eq arises at the sodium hydroxide plant itself. The other 45% is spread across the four supply chains, and the natural gas chain is the largest of them, at about a quarter of the total.
Figure 2. Global warming potential by sourcekg CO₂ eq per kg of sodium hydroxide
Sodium hydroxide plant, direct0.57 kg54.6%
Natural gas, combusted in boiler0.26 kg24.8%
Sodium chloride0.14 kg13.0%
Bituminous coal, combusted in boiler0.07 kg6.8%
Residual fuel oil, combusted in boiler0.01 kg0.7%
All categories
The same pattern, category by category
The table shows each source’s share of every impact category. Darker cells mean a bigger share. Two things stand out: the plant dominates ozone depletion and soil toxicity, and all of the mineral resource use comes from the salt stage.
Table 2. Share of each impact category by sourceEach column adds up to 100%
Scroll sideways to see all eleven categories.
Source
ADP elements
ADP fossil
AP
EP
FAETP
GWP
HTP
MAETP
ODP
POCP
TETP
Sodium hydroxide plant, direct
0%
54%
56%
68%
31%
55%
45%
72%
99%
68%
92%
Sodium chloride
100%
13%
11%
11%
24%
13%
17%
11%
0.3%
9.6%
2.7%
Natural gas, combusted in boiler
0%
27%
27%
12%
41%
25%
33%
10%
0%
19%
0.3%
Bituminous coal, combusted in boiler
0%
5.5%
6.0%
8.0%
0.8%
6.8%
3.5%
5.9%
0.8%
3.8%
5.2%
Residual fuel oil, combusted in boiler
0%
0.6%
0.3%
0.9%
3.2%
0.7%
1.7%
0.8%
0%
0.4%
0.1%
0%100%
Weighted score
Share of the overall weighted score
After normalisation and weighting, all eleven categories can be added into one score. On that single score, the plant accounts for 70%, and the salt and natural gas chains for about 12% each.
Figure 3. Contribution to the weighted score by sourceShare of total
Sodium hydroxide plant, direct69.9%
Sodium chloride12.0%
Natural gas, combusted in boiler11.5%
Bituminous coal, combusted in boiler5.7%
Residual fuel oil, combusted in boiler0.8%
Full breakdown, including transport
Transport is small in every chain. The largest single transport step, the diesel train carrying coal, stays under 0.1% of the weighted score.
Table 3. Process contributions to the weighted scoreShare of total
Process
Share of weighted score
Sodium hydroxide plant, direct
69.9%
Sodium chloride
12.0%
Diesel, combusted in industrial boiler
3.6%
Bituminous coal, combusted in industrial boiler
2.5%
Natural gas, combusted in industrial boiler
2.4%
Salt production, direct
3.6%
Natural gas, combusted in industrial boiler
11.5%
Combustion and gas supply, direct
11.2%
Transport, combination truck
0.23%
Transport, diesel train
<0.01%
Bituminous coal, combusted in industrial boiler
5.7%
Combustion, direct
5.4%
Bituminous coal at the mine
0.24%
Transport, diesel train
0.07%
Transport, barge
0.01%
Transport, combination truck
<0.01%
Residual fuel oil, combusted in industrial boiler
0.84%
Combustion and refinery supply, direct
0.84%
Transport, barge
<0.01%
Transport, combination truck
<0.01%
Transport, diesel train
<0.01%
Weighted results
Which impact categories matter most
Normalisation compares each result with a reference level of impact, and weighting then sets how much each category counts. Once that is done, one category towers over the rest.
Marine aquatic ecotoxicity makes up 92.9% of the weighted scoreHuman toxicity comes second at 3.0%. Global warming, the category most people ask about, is 0.66%.
Figure 4. Share of the weighted score by impact categoryCML, normalised and weighted
Marine aquatic ecotoxicity92.9%
Human toxicity2.99%
Abiotic depletion, fossil0.79%
Abiotic depletion, elements0.74%
Acidification0.70%
Global warming0.66%
Freshwater aquatic ecotoxicity0.51%
Photochemical ozone creation0.39%
Terrestrial ecotoxicity0.16%
Eutrophication0.03%
Ozone layer depletion0.01%
This is typical of CML results: marine ecotoxicity often dominates once results are weighted. Read the weighted score alongside the category results in Table 1, not instead of them. A 0.66% weighted share does not make 1.05 kg CO₂ eq per kg a small number for a buyer tracking its carbon footprint.
Key findings
Six numbers worth remembering
1.05 kg CO₂ eqCarbon footprint of 1 kg of sodium hydroxide at the plant gate, calculated with CML over 100 years.
55%Share of that footprint, 0.57 kg, that arises at the sodium hydroxide plant itself. The four supply chains add the other 45%.
25%Share contributed by the natural gas chain, 0.26 kg CO₂ eq. It is the largest of the four supply chains.
15 MJFossil energy drawn from the ground for every kilogram produced.
92.9%Share of the weighted score taken by marine aquatic ecotoxicity. Every other category is 3% or less.
Under 1%Share of both the carbon footprint and the weighted score that comes from the residual fuel oil chain, the smallest of the four.
Citing this case study
How to cite these results
Use of these results
This case study is published for demonstration and learning. The results are not intended for commercial use, such as product claims or procurement decisions. They may be cited in academic reports and papers.
Suggested citationDEISO LLC (2026). Life cycle assessment of sodium hydroxide production at plant, 1 kg: a case study using the CML impact assessment method. Tokyo: DEISO LLC.
Need a footprint for your own product?
DEISO runs cradle-to-gate and cradle-to-grave LCAs and product carbon footprints for chemical producers. Tell us the product, the site and what you need the result for.
An independent technical check of a finished LCA: whether the method is consistent, the assumptions are stated, and the study conforms to ISO 14040 and 14044.
Senior input on scope decisions, method choices and study planning for ISO-aligned LCA and EPD work, including advisory support before a study goes out.
Training and coaching run one-to-one or for a group and start as soon as the schedule and payment are confirmed, with no waiting for a cohort. Coaching is booked by the hour. Every DEISO trainer and coach is a PhD-level LCA expert.
Tell us what you need
Send a short brief: the product or study, the scope, and what the result is for. DEISO will come back with a quotation built around it.
Not every visitor knows what they need on day one. These seven onboarding paths cover the full range — from knowing exactly which service you want to starting from a question and letting AI guide you. Pick whichever fits.
Not ready to start on a specific path? These pages give you the fuller picture — the core identity, the platform layer, past work, and how to reach the team.
When you know the scope and are ready to move, submit a structured request — DEISO will scope the engagement to your context. Direct enquiries can also be sent to