

Satori AI Engine: Transforming Data into Actionable Narratives
Empowering decision-making through intelligent storytelling and dynamic data visualization.

Internal storytelling engine
Introducing Satori AI: DEISO’s internal storytelling engine
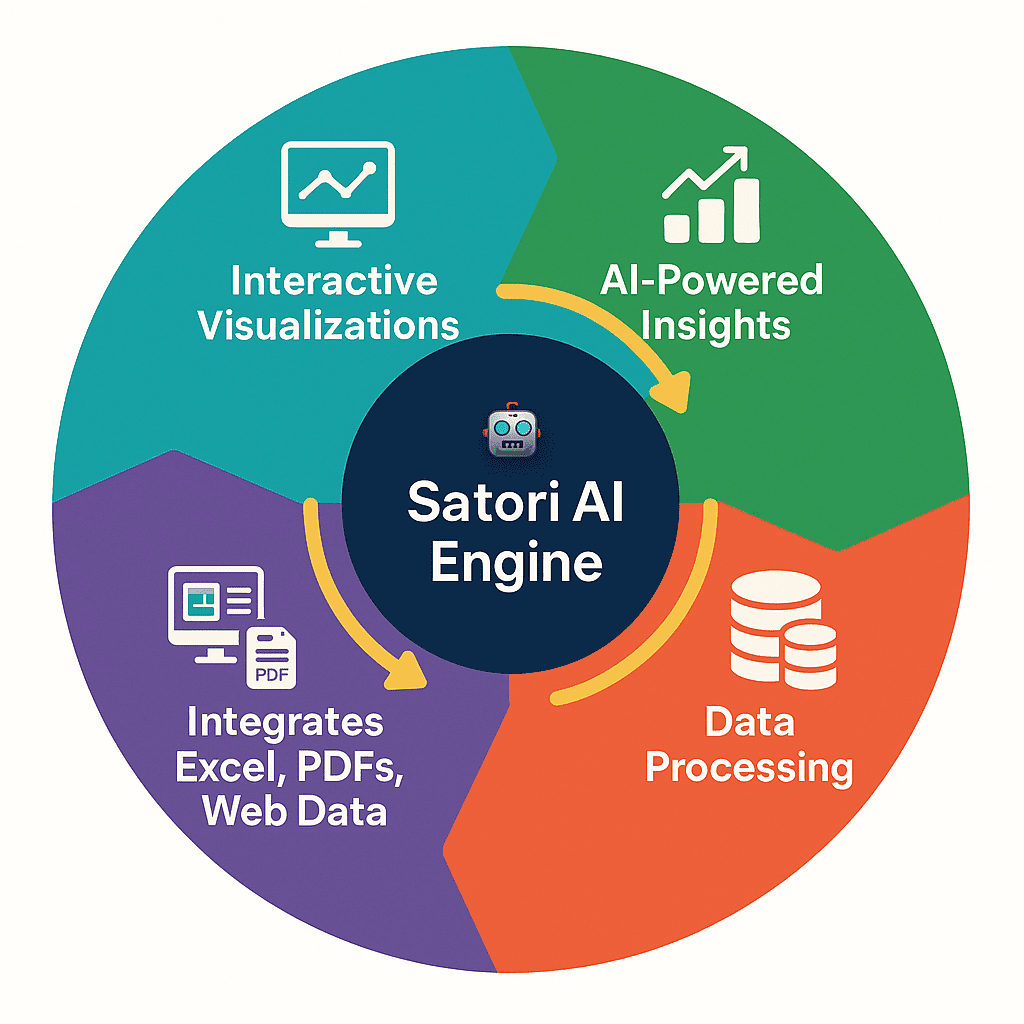
Satori AI is an advanced, proprietary AI engine developed by DEISO to convert complex datasets into insightful, interactive narratives. Integrated with the DEISO Visly platform, Satori AI lets DEISO’s team produce tailored storytelling outputs across a range of industries.
Definition
What is Satori AI?
- Purpose — transforms structured and unstructured data (Excel files, PDFs, web pages) into coherent, interactive stories
- Integration — works in tandem with DEISO Visly, producing dynamic visualizations and AI-supported insights
- Accessibility — used internally by DEISO; not available as a standalone product
Together, these models produce stories that are clearly presented, logically structured, data-driven, and built to support real-world action.
Capabilities
Key features of Satori AI
- Make complex data accessible — turn technical results into clear, readable narratives
- Strengthen audience engagement — reach stakeholders, clients, and partners through dynamic, visual-first communication
- Accelerate decision-making — stories built with AI surface insights faster, supporting sharper strategy
- Strengthen credibility — present case studies, project results, and achievements in a polished, high-impact format
- Applied proprietary AI for precision — DEISO’s own AI models support high accuracy and clarity of message
- Extract and analyze databases directly — the service supports direct extraction from Microsoft Excel, CSV files, and raw database exports, supporting full data integration and insight generation
Applications
Real-world applications of Satori AI
Example case studies showing where Satori AI is applied across sectors.
| No. | Use case | Description | Industry |
|---|---|---|---|
| 1 | Sustainability reporting | Transforms environmental data into comprehensive sustainability reports with actionable insights. | Environmental consulting |
| 2 | Market trend analysis | Analyzes market data to identify emerging trends and consumer behaviors. | Retail & e-commerce |
| 3 | Financial performance dashboards | Converts financial statements into interactive dashboards for real-time performance monitoring. | Finance & banking |
| 4 | Academic research summarization | Synthesizes large volumes of academic data into concise summaries and visual representations. | Education & research |
| 5 | Product lifecycle assessment | Evaluates product data to assess environmental impact throughout its lifecycle. | Manufacturing |
| 6 | Healthcare data interpretation | Interprets patient and clinical data to improve healthcare outcomes and operational efficiency. | Healthcare |
| 7 | Supply chain optimization | Analyzes logistics data to identify bottlenecks and optimize supply chain processes. | Logistics & transportation |
| 8 | Customer feedback analysis | Processes customer reviews and feedback to extract sentiments and areas for improvement. | Hospitality & tourism |
| 9 | Policy impact assessment | Evaluates the potential impacts of policy changes using historical and current data. | Government & public policy |
| 10 | Energy consumption monitoring | Tracks and visualizes energy usage patterns to promote efficiency and sustainability. | Energy & utilities |
Chart library
Charts supported by the Satori AI engine
| ID | Chart name | Chart type | Description | Example industries |
|---|---|---|---|---|
| 1 | Bar chart | Categorical | Compare values across categories using rectangular bars. | Retail, manufacturing, education |
| 2 | Stacked bar chart | Categorical | Show parts of a whole across multiple categories stacked in bars. | Finance, sustainability reporting |
| 3 | Column chart | Categorical | Vertical version of a bar chart for categorical comparisons. | Construction, energy |
| 4 | Stacked column chart | Categorical | Parts of a whole represented vertically in stacked columns. | Logistics, agriculture |
| 5 | Pie chart | Part-to-whole | Show percentage or proportion of categories within a whole. | Marketing, ESG reporting |
| 6 | Word cloud | Textual | Display frequency of words with size corresponding to frequency. | Customer feedback, tourism |
| 7 | Kernel density plot | Distribution | Show data distribution and estimate probability density. | Research, health sciences |
| 8 | Scatter plot | Correlation | Visualize relationship or correlation between two variables. | Engineering, real estate |
Summary
Grouped by chart type summary
| No. | Use case | Description | Industry |
|---|---|---|---|
| 1 | Sustainability reporting | Transforms environmental data into comprehensive sustainability reports with actionable insights. | Environmental consulting |
| 2 | Market trend analysis | Analyzes market data to identify emerging trends and consumer behaviors. | Retail & e-commerce |
| 3 | Financial performance dashboards | Converts financial statements into interactive dashboards for real-time performance monitoring. | Finance & banking |
| 4 | Academic research summarization | Synthesizes large volumes of academic data into concise summaries and visual representations. | Education & research |
| 5 | Product lifecycle assessment | Evaluates product data to assess environmental impact throughout its lifecycle. | Manufacturing |
| 6 | Healthcare data interpretation | Interprets patient and clinical data to improve healthcare outcomes and operational efficiency. | Healthcare |
| 7 | Supply chain optimization | Analyzes logistics data to identify bottlenecks and optimize supply chain processes. | Logistics & transportation |
| 8 | Customer feedback analysis | Processes customer reviews and feedback to extract sentiments and areas for improvement. | Hospitality & tourism |
| 9 | Policy impact assessment | Evaluates the potential impacts of policy changes using historical and current data. | Government & public policy |
| 10 | Energy consumption monitoring | Tracks and visualizes energy usage patterns to promote efficiency and sustainability. | Energy & utilities |
Short notes
What to keep in mind
- The Satori AI engine supports additional chart types over time as DEISO updates the system
- Industries are mapped so every chart type stays usable across DEISO’s supported sectors — ESG, LCA, EPD, PCF, sustainability, logistics, and healthcare among them
Next step
Discuss how Satori AI applies to your data and reporting
Share your dataset type, reporting audience, and target output — DEISO will scope the storytelling engagement to your context.
Share this:
- Email a link to a friend (Opens in new window) Email
- Share on LinkedIn (Opens in new window) LinkedIn
- Share on X (Opens in new window) X
- Share on Facebook (Opens in new window) Facebook
- Share on WhatsApp (Opens in new window) WhatsApp
- Share on Reddit (Opens in new window) Reddit
- Print (Opens in new window) Print
- More