

DEISO Spark: Unlock the Power of Your Data with AI
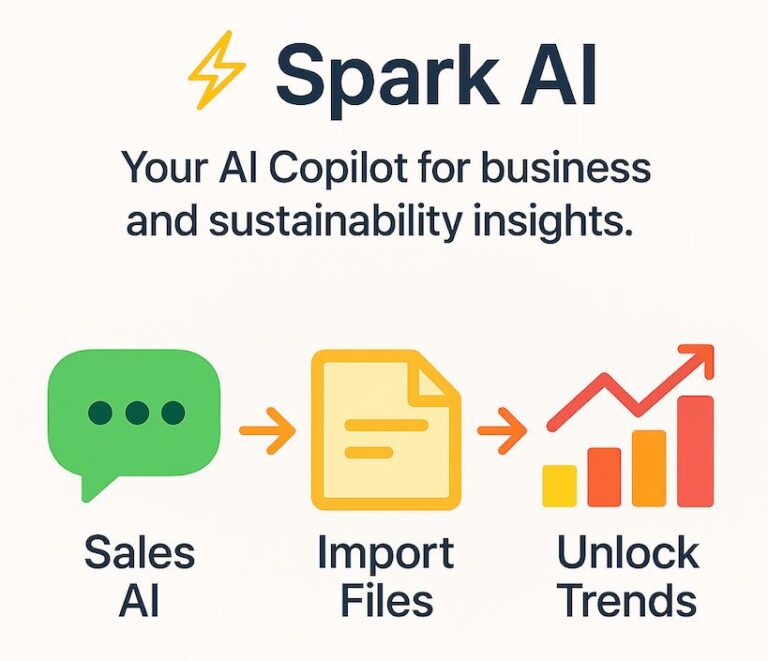


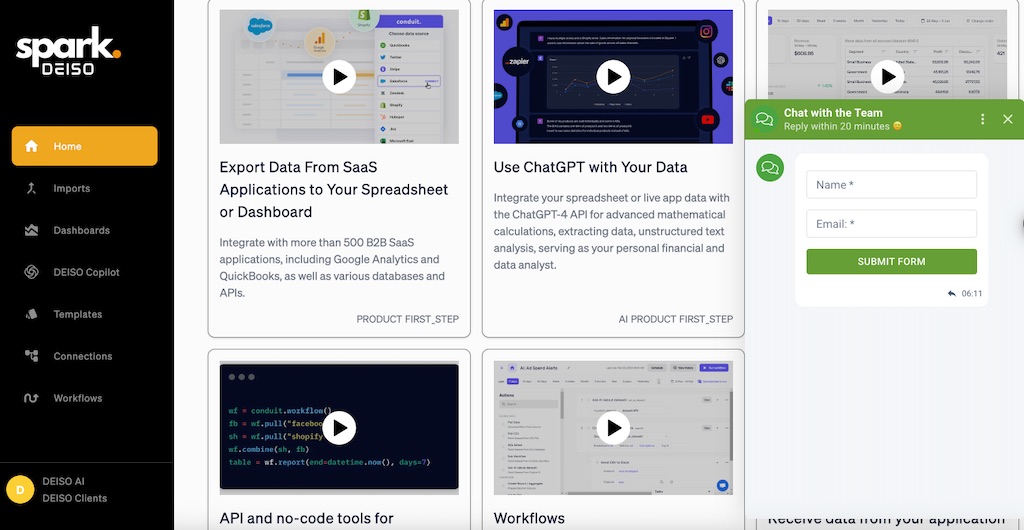
An integrated analytics capability inside DEISO engagements
DEISO Spark is a project-specific, AI-supported analytics and visualization platform purpose-built for DEISO's clients, partners, and internal teams. Rather than being sold as a product, Spark is deployed exclusively within specific DEISO projects and services, turning complex sustainability datasets into live dashboards, comparative visualizations, and decision-ready insight — across LCA, GHG, PCF, EPD, ESG, and adjacent sustainability programs.
Note. DEISO Spark is not available as a standalone product. It is an integrated capability enabled within DEISO's active client and research projects for specific engagements and services, and within selected training programs. It is also available to DEISO partners — at no additional cost.
What Spark does inside a DEISO engagement
Live sustainability dashboards
- Interactive dashboards for emissions, energy, and material flows
- Drill-down views by facility, product, category, or supplier
- Auto-refresh from connected sources with version control
Scope 1–4 emissions visualization
- Live Scope 1, 2, 3, and Scope 4 (avoided emissions) views
- Category-level Scope 3 hotspots and supplier concentration mapping
- Year-over-year comparisons with reduction pathway overlays
LCA visualization and interpretation
- Midpoint and endpoint result comparison across product alternatives
- Contribution analysis by process, material, or lifecycle stage
- Sensitivity analysis outputs surfaced in visual form
AI-supported analytics
- Automated hotspot detection and anomaly flagging
- AI-generated narrative summaries of dashboards and datasets
- Trend and pattern recognition across large sustainability datasets
ESG and disclosure dashboards
- ESG dashboards aligned with major frameworks and ISO standards (GRI, SASB, CSRD, SDGs, ISOs)
- KPI trend visualization for board and investor reporting
- Materiality-weighted views for disclosure prioritization
Product carbon footprint (PCF) views
- PCF results per functional unit with cradle-to-gate and cradle-to-grave options
- Comparative product footprints across variants and suppliers
- Reduction pathway modeling with visual scenario overlays
EPD-supporting visualizations
- Impact category visualizations aligned with EN 15804 and PCR requirements
- Data quality and completeness views for verification readiness
- Version control across draft and verified EPD outputs
Scenario and sensitivity modeling
- Side-by-side scenario comparison for reduction pathways
- Sensitivity sliders for emission factor, allocation, and boundary choices
- Monte Carlo uncertainty visualization on high-materiality categories
Data integration and connectors
- Integration with SimaPro, openLCA, and GaBi outputs
- Import from Excel, CSV, and structured supplier data files
- Direct integration with DEISO Visly project workspaces
Reporting and export
- Export dashboards to PDF, image, and interactive share links
- Embed views into DEISO Visly reports and client presentations
- Timestamped snapshots for verification-ready evidence packages
Collaboration and access control
- Role-based access for internal teams, clients, and verifiers
- Inline commenting and annotation on dashboards and charts
- Approval workflows with timestamped audit trail
Secure hosting and deployment
- Hosted under DEISO's secure cloud infrastructure
- SSL encryption, role-based access, and GDPR-aligned data handling
- Private workspaces for internal R&D, client projects, and verifiers
Where Spark is deployed inside DEISO projects
Life cycle assessment (LCA)
- Visualize and compare midpoint and endpoint results across product alternatives
- Contribution analysis by process, material, or lifecycle stage
- Interpretation dashboards for verification and reviewer readiness
GHG accounting
- Live Scope 1–4 dashboards with trend and hotspot views
- Mitigation pathway visualization tied to measured baselines
- AI-generated summaries of annual emissions performance
Product carbon footprint (PCF)
- PCF views per product, variant, and supplier
- Comparative footprint modeling for procurement and design decisions
- Sensitivity and scenario overlays for reduction planning
Environmental Product Declarations (EPD)
- PCR-aligned impact category visualizations
- Data quality dashboards supporting verification readiness
- Version control across draft and verified outputs
Sustainability reporting and ESG
- Framework-aligned ESG dashboards (GRI, SASB, CSRD, SDGs, ISOs)
- Materiality-weighted KPIs for board and investor reporting
- AI-supported narrative generation for disclosure sections
Training and research collaboration
- Live dashboards embedded inside DEISO training programs
- Simulation labs for GHG, LCA, and EPD workshops
- Real-time analytics support for research collaboration
How Spark is provisioned
DEISO Spark is available only as part of specific DEISO projects and services — for DEISO clients, partners, and teams. It is not sold separately. Every DEISO consulting engagement, training program, or collaborative project can be provisioned with a Spark-powered environment tailored to the client's scope.
Want to see how Spark can power your next sustainability project? Contact us at or get started at go.dei.so.
Bring Spark into your next DEISO sustainability project
Share your engagement scope — reporting, LCA, EPD, GHG, ESG, or training — and DEISO will provision a Spark workspace tailored to the project.
Share this:
- Email a link to a friend (Opens in new window) Email
- Share on LinkedIn (Opens in new window) LinkedIn
- Share on X (Opens in new window) X
- Share on Facebook (Opens in new window) Facebook
- Share on WhatsApp (Opens in new window) WhatsApp
- Share on Reddit (Opens in new window) Reddit
- Print (Opens in new window) Print
- More