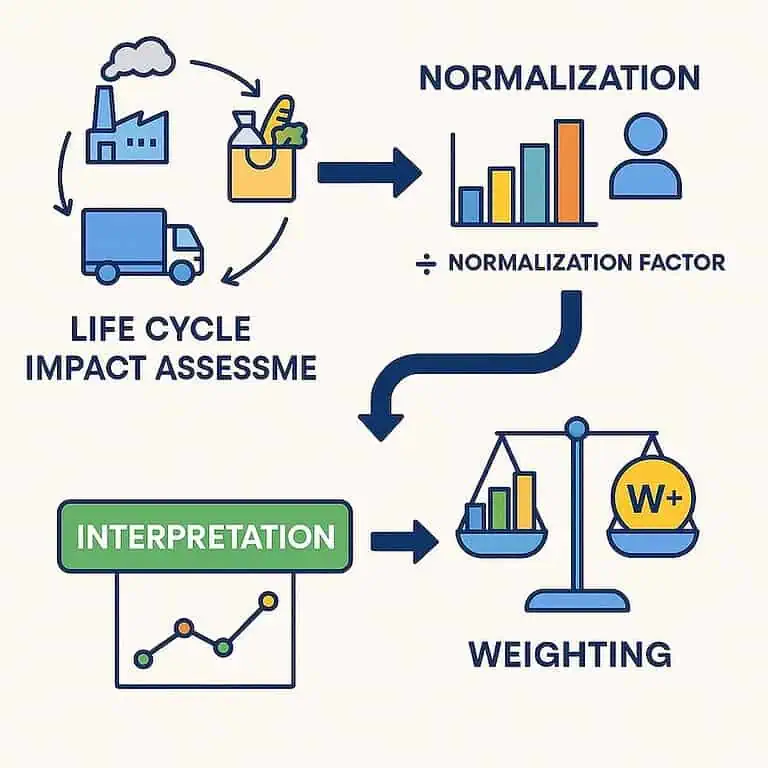
🔹 Section 1: What Is Normalization in LCA?
Normalization is the process of placing environmental impact results into context by comparing them to a reference value, such as a per capita or total national impact. This allows comparisons across impact categories that originally use different units.
📘 Formula:
Normalized Result = LCIA Result ÷ Normalization Factor
🧠 Real-Life Analogies:
Calories in a Meal: 800 kcal is 32% of a 2,500 kcal daily limit.
Company Revenue: A $1M startup vs. Amazon’s $500B.
Rainfall Context: 30 mm is minimal in a rainforest but heavy in a desert.
🎯 Normalization helps you understand relative significance.
🔹 Section 2: Why Is Normalization Optional According to ISO?
According to ISO 14044, normalization is not mandatory in an LCA study. It’s an interpretative tool to enhance understanding but isn’t required for compliance.
Enhances insight, not calculations
Requires external reference values
May introduce subjectivity if poorly sourced
Not necessary for direct comparison between products
🔹 Section 3: What Are Normalization Factors?
Normalization Factors (NFs) are reference values representing environmental burdens of an average person, country, or world in a given year.
📌 Examples:
🔹 Impact Categories and Normalization Factors
| Impact Category | NF Value | Source / Region |
|---|---|---|
| Climate Change | 8.6 t CO₂ eq/person/year | EF v3.1 – Europe |
| Acidification | 45 mol H⁺ eq/person/year | CML – Japan |
| Human Toxicity (cancer) | 0.002 CTUh/person/year | ReCiPe – Global |
Section 4: Where to Get Normalization Factors
Official LCIA methods: EF v3.1, ReCiPe, IMPACT 2002+, CML
LCA tools: OpenLCA, SimaPro, GaBi
Peer-reviewed literature
Government databases (e.g., EPA, EU)
Custom calculations using national statistics
Section 5: Where to Get Normalization Factors
Official LCIA methods: EF v3.1, ReCiPe, IMPACT 2002+, CML
LCA tools: OpenLCA, SimaPro, GaBi
Peer-reviewed literature
Government databases (e.g., EPA, EU)
Custom calculations using national statistics
🔹 Section 6: What If Normalization Factors Are Missing?
You can construct NFs yourself:
Example (Japan):
GHG emissions = 1.1 Gt CO₂ eq
Population = 125M
NF = 1,100,000,000 / 125,000,000 = 8.8 t CO₂ eq/person/year
🔹 Section 7: How to Calculate Normalized Results
Formula:
Normalized Result = LCIA Result / Normalization Factor
Example:
LCIA = 1200 kg CO₂ eq
NF = 8800 kg CO₂ eq/person/year
→ Normalized result = 0.136
🔹 Section 8: Raw vs. Normalized Comparison
🔹 Impact Category – Raw vs. Normalized Results
| Impact Category | Raw Result | Normalized Result |
|---|---|---|
| Climate Change | 1200 kg CO₂ eq | 0.136 |
| Acidification | 98 mol H⁺ eq | 0.217 |
| Human Toxicity (Cancer) | 0.0015 CTUh | 0.75 |
| Water Use | 50 m³ | 0.0041 |
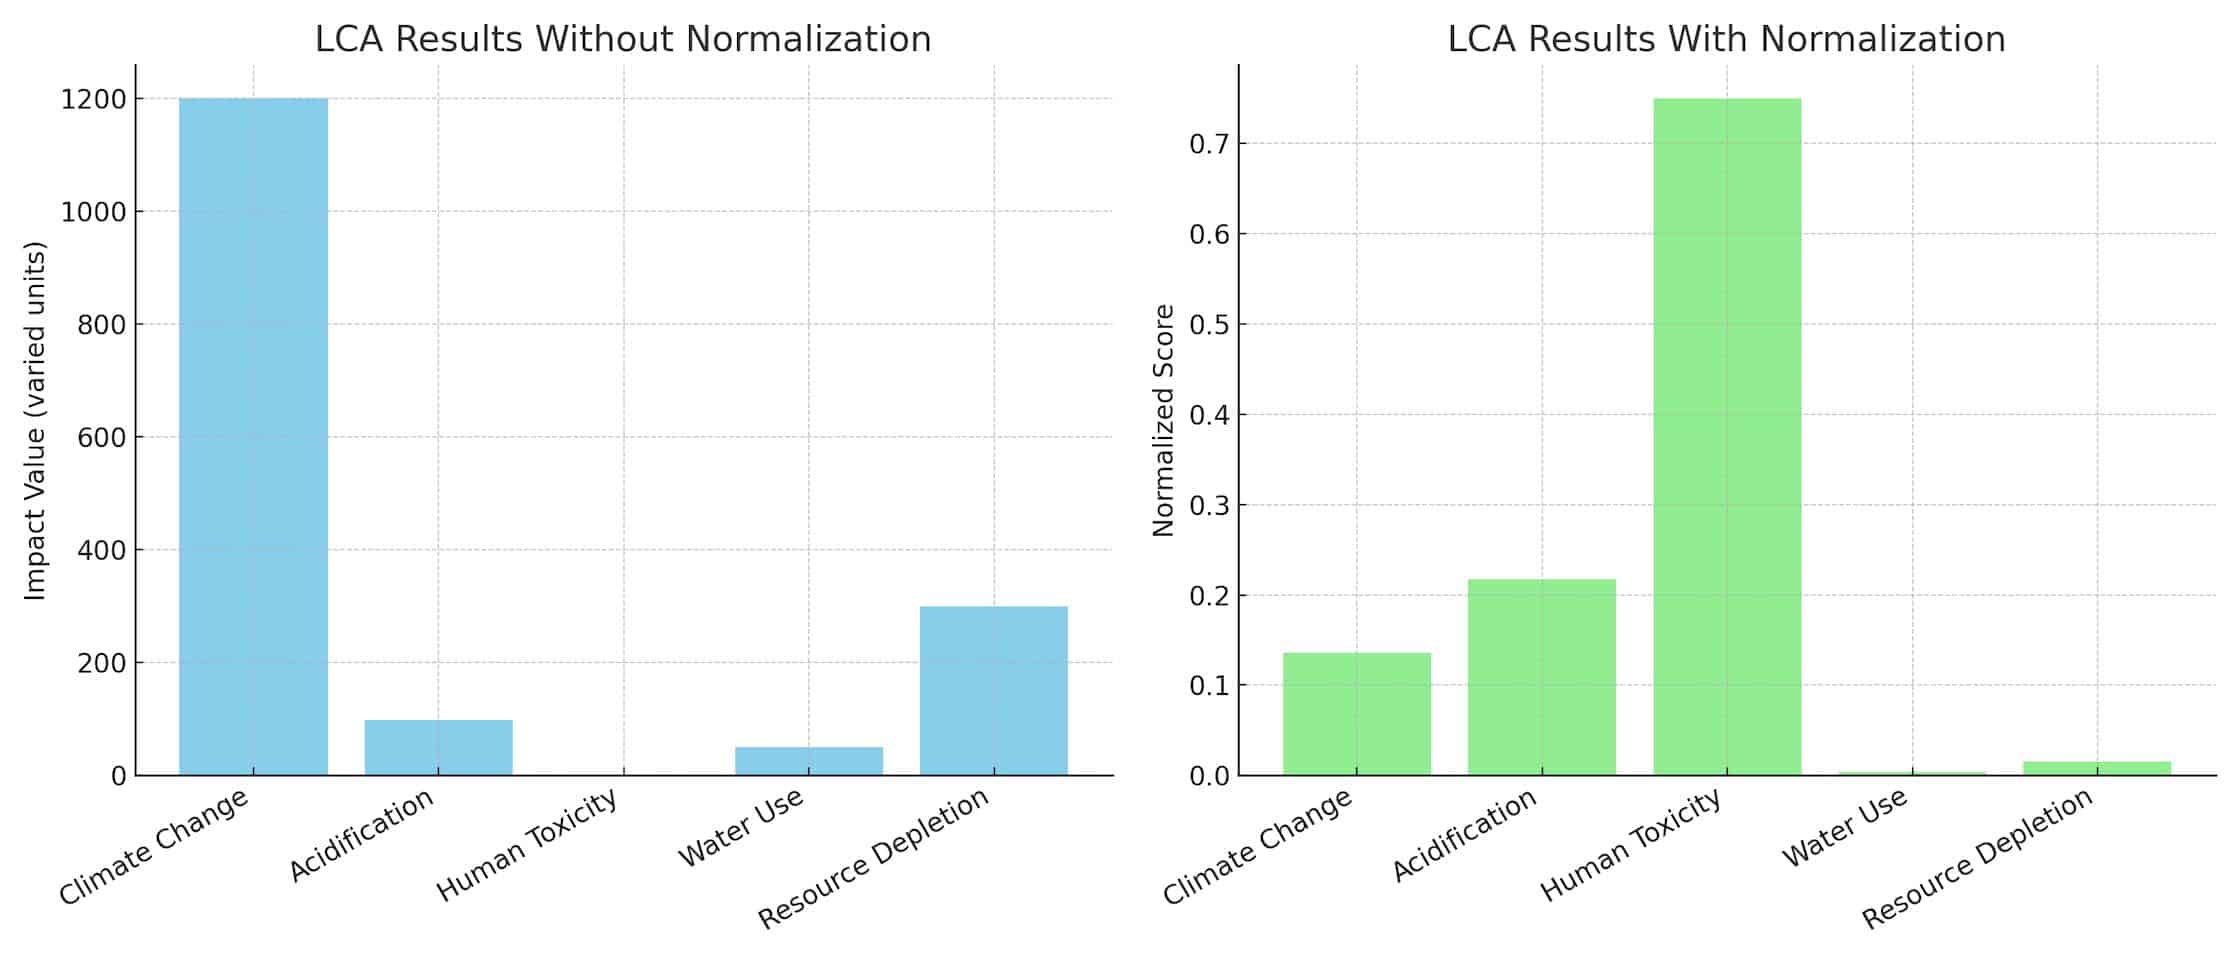
📊 Visual Comparison and Interpretation
The diagram above shows the same LCA results represented in two ways.
The left chart displays the raw LCIA results, where each environmental impact category is shown using its original units (e.g., kg CO₂ eq, CTUh, m³).
The right chart shows those same results after normalization — each value is divided by a reference normalization factor, typically representing the average annual burden of a person or region.
At first glance, the normalized chart may appear to contradict the raw data. For example:
Human Toxicity looks negligible in the raw data but becomes one of the most significant impacts after normalization.
Climate Change, which looks dominant in the raw chart, seems less significant when normalized.
This change can be surprising, but it does not mean the results were altered or manipulated.
🔍 Why this happens:
Normalization does not change the raw results — it rescales them to reflect their relative significance compared to the average environmental burden in each category. Here’s what that means:
✅ Example 1: Human Toxicity
Raw result: 0.0015 CTUh — looks tiny
Normalization Factor: 0.002 CTUh/person/year → this is a very small environmental budget
Normalized: 0.0015 / 0.002 = 0.75 → or 75% of a person’s average annual toxicity burden
✅ Conclusion: The process is disproportionately impactful in this category — even though the raw number seemed small.
✅ Example 2: Climate Change
Raw result: 1200 kg CO₂ eq — seems large
Normalization Factor: 8600 kg CO₂ eq/person/year
Normalized: 1200 / 8600 = 0.136 → or 13.6% of the average person’s yearly emissions
✅ Conclusion: Climate change impact is relatively low compared to societal norms, even if the number is large in isolation.
🎯 Key Takeaways:
Normalization reveals disproportionate contributions in categories where the average impact is small
Conversely, it shrinks results in categories that are already heavily burdened globally or regionally
This is not a contradiction — it’s a contextual adjustment
❓ So why do normalized charts look different?
Because normalization:
Makes all results dimensionless and comparable
Reflects how much each result contributes to known total environmental burdens
Allows cross-category comparisons that raw results cannot offer
✅ Final Clarification
Normalization does not change the original values or LCIA results.
It only changes the lens through which those results are interpreted.
The same 1200 kg CO₂ eq is still 1200 kg — but normalized, it’s just 13.6% of a person’s average.It’s the same data — just contextualized.
🔹 Section 9: What Normalization Changes — And Doesn’t
✅ Normalization does not:
❌ Change actual LCIA values
❌ Alter units
❌ Affect EPD or verification compliance
✅ Normalization does:
✅ Contextualize results
✅ Allow cross-category comparison
✅ Highlight relative importance
🧠 It’s a lens, not a transformer.
🔹 Section 10: What Is Weighting in LCA?
Weighting is the step after normalization. It involves applying a value (weight) to each impact category to reflect its importance in decision-making or policy.
🧠 Real-Life Analogies:
Exam Grades: Science = 40%, PE = 5%
Budget Allocation: More budget for healthcare than for PR
Shopping Choices: You might value price more than brand
🔹 Section 11: Why We Use Weighting
Helps prioritize what matters most
Enables single-score evaluation
Supports policy, purchasing, or design decisions
Aligns results with stakeholder values
🔹 Section 12: How to Apply Weighting
Formula:
Weighted Score = Normalized Score × Weight
🔹 Pros and Cons of Normalization
| Pros | Cons |
|---|---|
| Enables cross-category comparison | Depends on region-specific data |
| Highlights high relative burdens | May not be available for all categories |
🟥 🔔 Important Notice: Weighting Requires Normalization First
📌 You cannot apply weighting without applying normalization first.
❌ Why?
Because raw LCIA results are reported in different units:
Climate Change → kg CO₂ eq
Acidification → mol H⁺ eq
Human Toxicity → CTUh
Water Use → m³
Resource Use → MJ
These units are incompatible for direct comparison or mathematical weighting.
✅ What Normalization Does:
Normalization converts all category results into dimensionless scores by dividing them by normalization factors (e.g., average annual environmental burden per person). This step:
Removes units
Places all categories on the same scale
Enables consistent weighting and ranking
🧠 Summary:
Without normalization, applying weighting is scientifically invalid and will result in misleading interpretations.
🔹 Section 13: Can Weighting Be Used Without Normalization?
❌ No — because LCIA results use different units.
Without normalization, weighting apples, kilograms, and CTUh directly is invalid.
✅ Weighting only works after normalization, when all values are dimensionless and comparable.
🔹 Section 14: When to Use Normalization vs. Weighting
Not every LCA study requires the same level of interpretation. Whether you use normalization, weighting, or both depends on why you’re performing the LCA and how the results will be used. These steps can change the interpretive lens, even though the underlying results remain the same.
Normalization provides contextual relevance — it helps you see how significant each impact category is in relation to global or regional totals. Weighting, on the other hand, helps you prioritize those normalized results according to stakeholder values, policies, or goals. Choosing when to apply either method — or both — is critical to producing meaningful, actionable results.
🔹 Recommended Interpretation Methods by Use Case
| Use Case | Method to Apply |
|---|---|
| Academic or scientific LCA | Normalization only |
| Policy-based decisions | Normalization + Weighting |
| Public communications | Normalization + Weighting |
| Cross-impact comparisons | Normalization only |
| Rapid screening or ranking | Normalization + Weighting |
🔹 Section 15: Best Practices for Normalization & Weighting
✅ Best Practices for Normalization:
Match the method, region, and year
Document all sources clearly
Avoid mixing normalization sets
Use per capita or total inventory where needed
Show both normalized and raw values in reporting
✅ Best Practices for Weighting:
Apply only after normalization
Use stakeholder-approved or method-official weights
Disclose all assumptions clearly
Include both weighted and unweighted results
Avoid one-size-fits-all scores without transparency
🔹 Pros and Cons of Normalization
| Pros | Cons |
|---|---|
| Enables cross-category comparison | Depends on region-specific data |
| Highlights high relative burdens | May not be available for all categories |
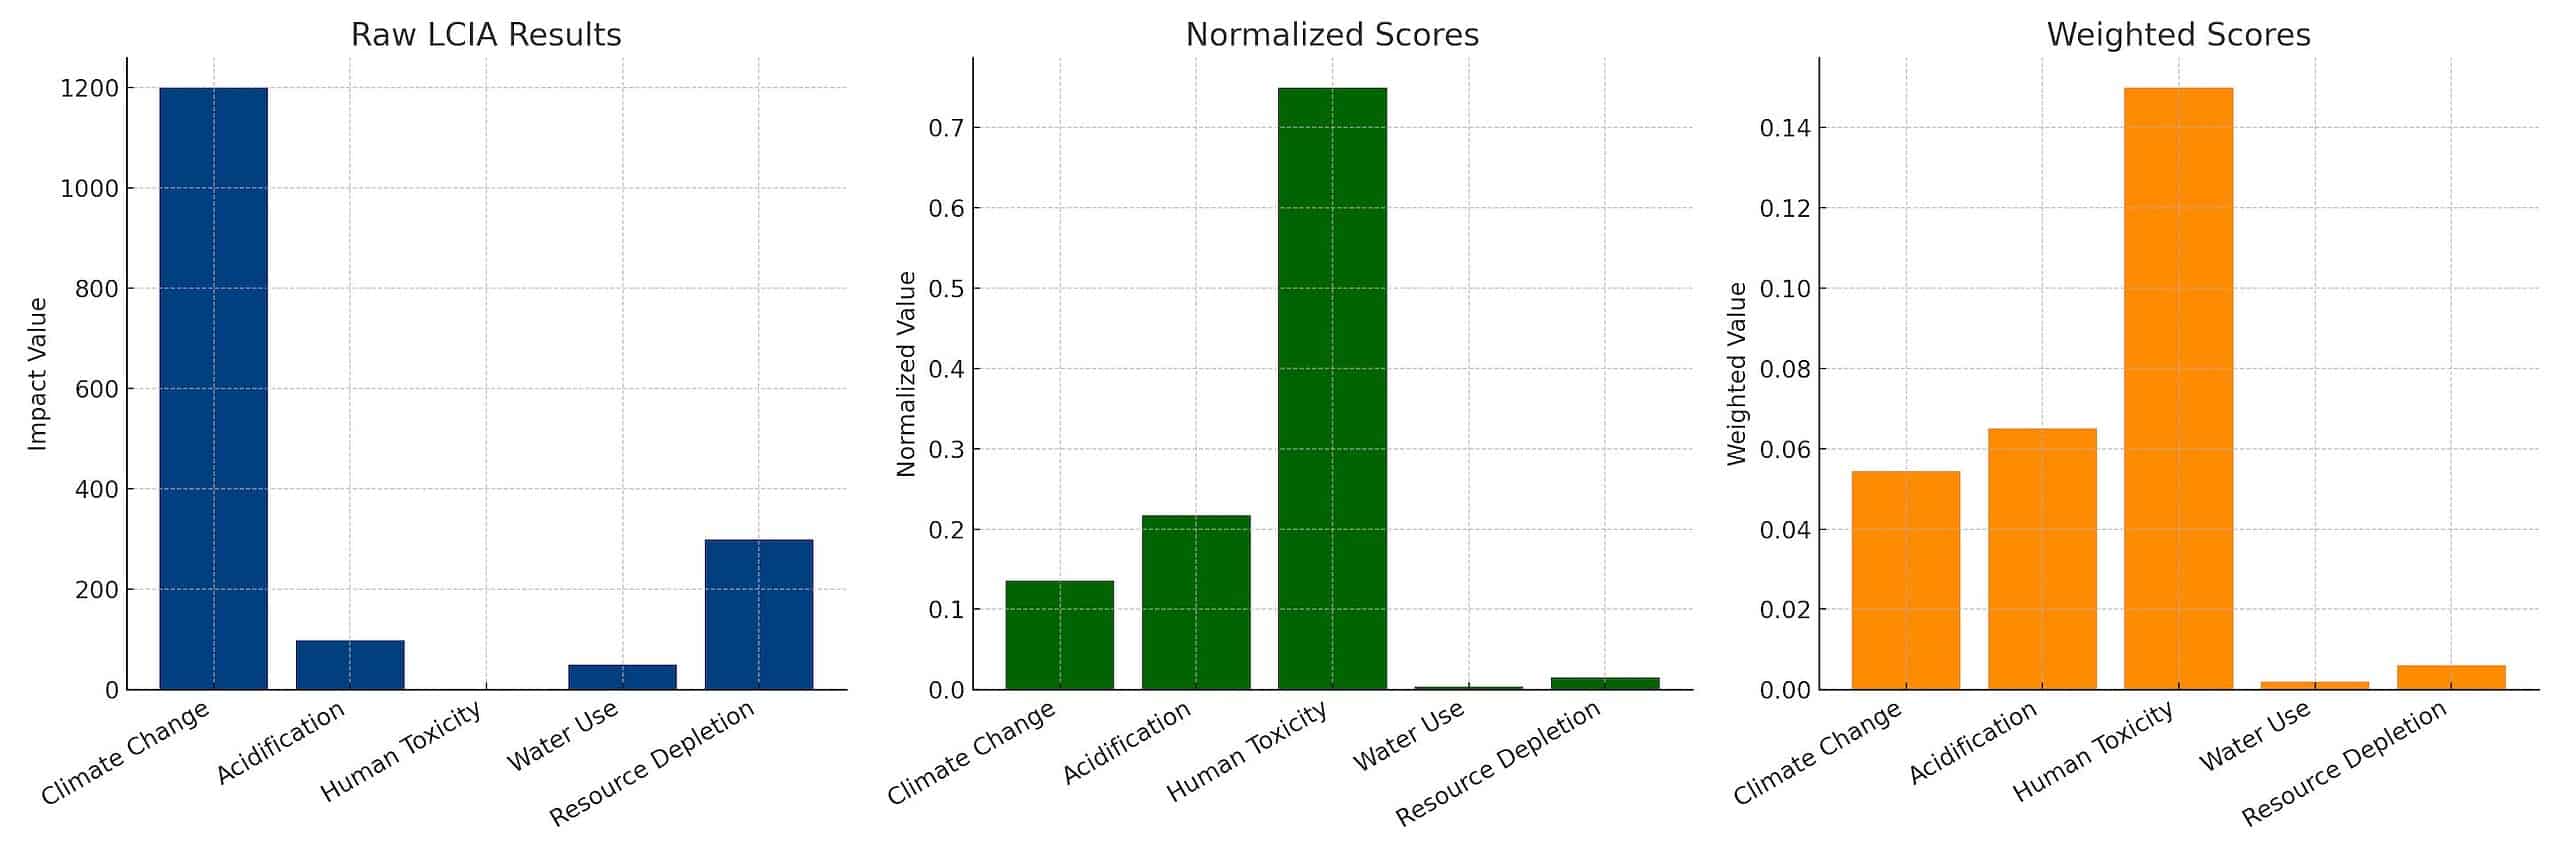
📊 Why Weighted Results May Look Similar to Normalized Results — and Why It Still Matters
In the chart above, you may notice that the Weighted Scores (right panel) appear almost identical in pattern to the Normalized Scores (middle panel). For instance, Human Toxicity remains the most significant in both, while Climate Change drops in relative prominence.
This can feel counterintuitive — if weighting is supposed to shift priorities, why do the rankings look the same?
🔍 Why the Weighted Results Often Mirror the Normalized Ones
Weighting factors were proportional or moderate
– When weighting values (e.g., 0.2, 0.3, 0.4) are not drastically different across categories, they merely scale the normalized scores rather than reorder them.Normalization already captures environmental relevance
– Methods like EF v3.1 and ReCiPe use normalization factors based on societal or regional burdens.
– So, normalization itself already emphasizes categories like Human Toxicity or Climate Change according to their real-world significance.No extreme trade-offs were introduced by weighting
– If all categories are treated as relatively equal in importance, weighting refines results — it doesn’t restructure them.
❓ So What’s the Point of Applying Weighting If the Results Stay the Same?
📌 This is a critical insight:
Weighting doesn’t always change the shape of the results — but it changes the purpose.
Here’s why weighting still matters even when it doesn’t change the bar height order:
✅ What Weighting Adds That Normalization Alone Does’
🔹 Purpose of Weighting in LCA
| Purpose of Weighting | Why It Matters |
|---|---|
| 🎯 Assigns importance | Reflects policy priorities or stakeholder values |
| 📊 Enables decision-making | Used in product comparison, procurement, and EPD reporting |
| 🧠 Condenses interpretation | Converts multi-category data into a single score if needed |
| 📎 Links LCA to action | Makes results easier to explain, defend, and justify |
Weighting answers the question:
“Now that we know how much each category matters (via normalization), how much should we care, based on our goals?”
🔹 Section 16: Learn by Doing — DEISO LCA Training Programs
DEISO offers premium Life Cycle Assessment (LCA) training at multiple levels:
🎓 Training Levels:
Basic – For absolute beginners
Professional – From beginner to mid-level competence
Advanced – Full LCA modeling and interpretation
Expert – Methodology, data sourcing, and tool mastery
Expert+ – High-level specialization + cross-software applications
🔹 Section 17: Comparison of Interpretation Strategies in LCA
Choosing how to interpret LCA results — whether raw, normalized, or weighted — can significantly affect how those results are understood and acted upon. Here’s a comparative summary of each strategy:
🔹 Comparison of LCA Interpretation Approaches
| Approach | Advantages | Disadvantages | Best Used For |
|---|---|---|---|
| ❌ Raw Results Only |
- Transparent, unprocessed values - Easy to trace source data |
- Difficult to compare across categories - No context or prioritization |
Academic studies, raw data reporting |
| ✅ Normalized Only |
- Allows cross-category comparison - Highlights disproportionate impacts |
- Can be misinterpreted without context - Still lacks policy direction |
Benchmarking, scientific analysis |
| ✅✅ Normalized + Weighted |
- Enables decision-making - Reflects stakeholder priorities - Offers a single aggregated score |
- Adds subjectivity - May obscure raw differences - Requires justification |
EPDs, procurement, policy decisions, product ranking |
🧠 Summary Insight:
Normalization gives you perspective
Weighting gives you priorities
Raw results give you precision, but no meaning across impact types
For most applied LCA applications — especially product comparison, EPDs, or sustainability decisions — the combination of normalization + weighting is preferred.
🔹 Section 18: Learn by Doing — DEISO LCA Training Programs

DEISO offers premium Life Cycle Assessment (LCA) training at multiple levels:
🎓 Training Levels:
Basic – For absolute beginners
Professional – From beginner to mid-level competence
Advanced – Full LCA modeling and interpretation
Expert – Methodology, data sourcing, and tool mastery
Expert+ – High-level specialization + cross-software applications
🛠️ Software-Based LCA Training:
We provide hands-on training in:
Each software program has a custom training track, starting from zero knowledge, developing learners to their target level (e.g., Professional → Expert).

✅ Delivered By
Expert instructors from both academia and industry
Supported by real case studies, simulations, and global best practices
🧭 Delivery Formats:
✅ Remote (Online) – via Zoom/Teams (live or recorded)
✅ Onsite (Tokyo) – at DEISO office or client location
✅ Offsite (Custom location) – for companies or group bookings outside Tokyo
👥 Training Types:
✅ One-to-One Coaching – fully personalized, private sessions
✅ Group Training – corporate, academic, or institutional groups
✅ Modular Programs – progressive levels from Basic to Expert+
✅ Customized Tracks – LCA methodology + chosen software tool (SimaPro, openLCA, GaBi)
📩 Interested in becoming an expert in normalization, weighting, and LCA tools?
👉 Contact DEISO by filling out the contact form here.
Training Links
- Life Cycle Assessment (LCA) Training: https://dei.so/deiso-life-cycle-assessment-lca-professional-training-programs
- openLCA Training: https://dei.so/openlca-training-programs
- LCA for Experts (GaBi) Training: https://dei.so/gabi-lca-training-programs
- SimaPro Training: https://dei.so/simapro-lca-training-programs
Share this:
- Email a link to a friend (Opens in new window) Email
- Share on LinkedIn (Opens in new window) LinkedIn
- Share on X (Opens in new window) X
- Share on Facebook (Opens in new window) Facebook
- Share on WhatsApp (Opens in new window) WhatsApp
- Share on Reddit (Opens in new window) Reddit
- Print (Opens in new window) Print
- More